The Reputation Management Dashboard gives you a real-time snapshot of your performance across key fulfillment and quality metrics..
Use this dashboard to:
Track warehouse performance
Track offer performance
Take corrective actions before small issues become major problems
Avoid penalties such as low offer visibility or warehouse deactivation
How to Access your Reputation Management Dashboard
Follow these simple steps to view your real-time Reputation Management Dashboard:
Log in to your Seller Lab account.
Go to the Account Health & Report section from the main menu.
Select Reputation Management from the available options.
The dashboard is updated daily, allowing you to monitor key operational metrics and address issues before they affect your account.
You can also click on the (i) button to check the different status tiers and the importance of maintaining good account health.
1. Item Defect Rate (IDR)
- What it measures:
The percentage of items delivered in the last 60 days that either have a Negative Feedback or a Seller-Controllable Return.
- Negative Feedback: The percentage of items delivered in the last 60 days that received a low seller rating from the customer (either 1 or 2 stars)
- Seller-Controllable Returns: were returned due to seller-controllable reasons (e.g., damaged, wrong item). Customer reasons like “item no longer needed” do not count against your IDR.
You can view the breakdown of Negative Feedback and Seller Controllable Returns on the offer level under the Satisfaction section.
Where to view item-level details:
- Seller Reviews: You can check your product ratings and customer reviews.
- Returns: Monitor return trends and identify seller-controllable return reasons using the Returns Reduction Dashboard. This dashboard helps you analyze the causes of returns and take proactive steps to reduce them.
- How is IDR calculated:
(Low Rated Items + Seller Controllable Returns) ÷ Delivered Items × 100
- How this metric affects you:
If your offers have a high Item Defect Rate (IDR), your Account Health will be affected, and offer visibility on the platform could be impacted. In some cases, this may even lead to offer deboosting if no corrective action is taken.
- Who Does It Apply To:
All fulfillment models, including FBN and Direct Ship modes.
2. Cancellation Rate
- What it measures:
The percentage of fulfillment requests canceled due to stock unavailability over the last 10 days.
- Where to view your warehouse performance:
You can monitor your Cancellation Rate and other warehouse performance metrics from the Shipping section under the Account Health.
- Scroll down to check your cancellation rate and the SKUs that are canceled.
For SKU-level details and trends, please click here.
- How is Cancellation Rate calculated:
Items Cancelled as OOS ÷ Total Items to Fulfill × 100
- How this metric affects you:
High Cancellation Rate negatively affects your Account Health and may lead to performance penalties
- Who Does It Apply To:
Applies only to DirectShip and Direct Delivery models. FBN is excluded.
3.Late Shipment Rate (LSR)
- What it measures:
The percentage of items shipped after their Estimated Shipping Date (ESD) in the last 10 days.
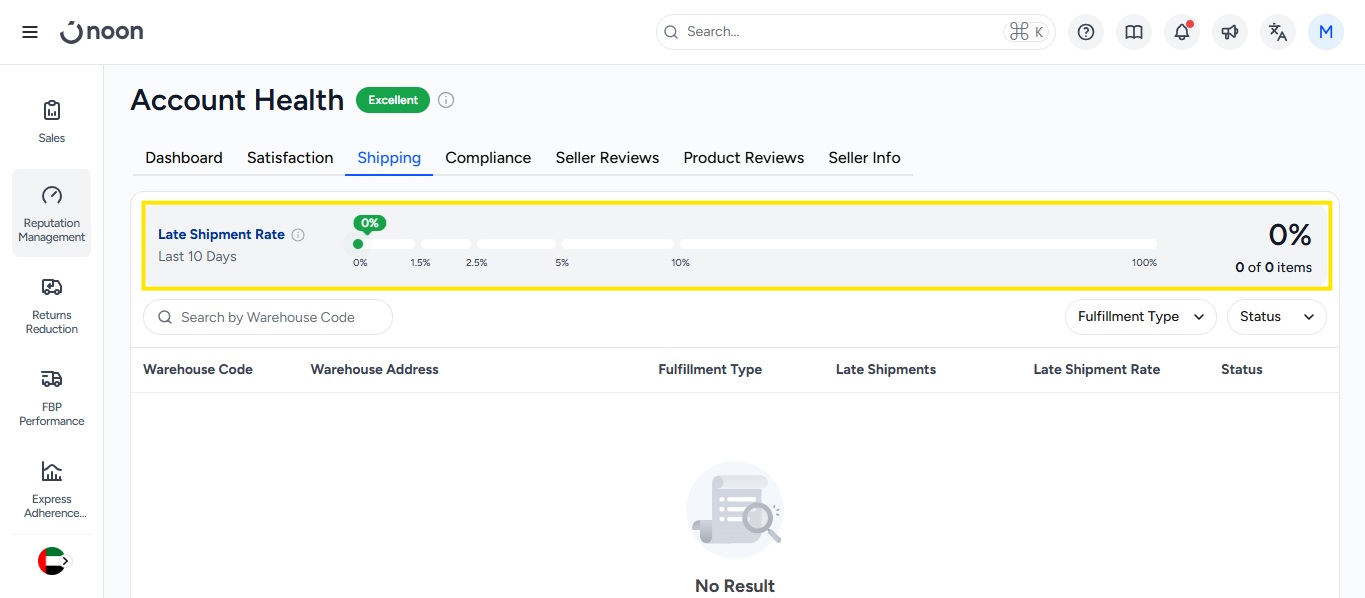
- How is LSR calculated:
Items Shipped Late ÷ Total Fulfilled Items × 100
- How this metric affects you:
Timely shipping is crucial for a good customer experience. High LSR may impact your Account Health as well as offer visibility on the platform. In some cases, this may even lead to warehouse-level deactivation if no corrective action is taken.
- Who Does It Apply To:
Applies only to DirectShip and Direct Delivery models. FBN is excluded.
4. Compliance
- What it measures:
The policy violation code and the type over the past 180 days.
- How is Compliance evaluated:
Our baseline score is 80. An increase in sales volume will improve your Account Health, whereas a decrease will reduce your score and incur violation penalty points. The policy violations are evaluated based on evidence gathered by noon, the details of which are shared on your registered email.
- How this metric affects you:
Indication of not complying with noon’s policies, which puts noon, and its internal and external stakeholders at risk. Policy violations may impact your offer visibility on the platform.
In some cases, this may even lead to account-level deactivation if no corrective action is taken.
5. Account Health Score
- What it measures: The overall account health of the partner.
- How is Account Health Score evaluated: The minimum score across Customer Satisfaction, Shipping Performance, and Policy Compliance.
- How this metric affects you: This indicates that at least one among the Customer Satisfaction, Shipping Performance and Policy Compliance metrics may not be complying with noon’s policies, which puts noon, and its internal and external stakeholders at risk. This may impact your offer visibility on the platform and may even lead to account-level deactivation if no corrective action is taken.
| Status | Meaning | What You Need to Do |
| Excellent | All metrics are well within safe limits | You're performing well — keep up the good work!
Monitor your dashboard regularly to maintain this status. |
| Great | All metrics are within safe limits | You have scope to improve your performance further. |
| Average | At least 1 metric is just about meeting the basic criteria | Your performance is at the borderline and has room for improvement. |
| At Risk | At least 1 metric is below the threshold | The visibility of your offers may be impacted, so you need to improve your performance immediately |
| Critical | At least 1 metric is much below the threshold | Your account is at risk of going offline |
Warehouse-Level breakdown
Each metric is clearly broken down by:
Country
Warehouse Code & Address
Processing Method:
FBN - Fulfilled by noon
DS - Directship
DD - Direct Delivery
Performance Categories (Healthy, At Risk, High Risk, Unhealthy, N/A).
N/A: a particular warehouse doesn’t qualify for evaluation
How to Stay Compliant
Regularly monitor your Reputation Management Dashboard in Seller Lab
Keep inventory updated to avoid stockouts
Ship on time and within your processing window
Address product quality concerns proactively
Avoid policy violations (e.g., counterfeit, restricted products, manipulated ratings)
Submit a Plan of Action (POA) : If a warehouse status turns red, you have 7 days to respond with a plan of action.
You can do this by replying to the email you received requesting a POA, or by sending your response directly to seller@noon.com.
What Should You Do Based on Status Color?
Status | Meaning | What You Need to Do |
🟢 Green
(Healthy)
| All metrics are within safe limits
| You're performing well—keep up the good work!
Monitor your dashboard regularly to maintain this status.
|
🟡 Yellow
(At Risk)
| Minor issues detected; metrics approaching threshold | Start identifying the cause of the issues. Take preventive steps
to avoid further decline (e.g., check return reasons, shipment delays, or stock accuracy).
|
🟠 Amber
(High Risk)
| Performance is below standard; nearing critical level | Immediate action recommended! Review impacted metrics in Seller Lab and
prepare a Plan of Action (POA). Fix operational issues before the status turns red. |
🔴 Red
(Unhealthy)
| Critical performance issues; threshold exceeded
| You have 7 days to:
Submit a Corrective Action Plan in Seller Lab
Or raise a dispute if you believe the metric is incorrect
During this time, the affected warehouse and its corresponding offers, will have low offer visibility & will lose advertisement promotional privileges on the platform.
If no action is taken, warehouse deactivation will occur.
|
Need Help or Want to Submit a POA?
Reach out to us at seller@noon.com.
That’s it!
Got more questions?